You know my method. It is founded upon the observation of trifles. ~ Sherlock Holmes
Why use the UFT Debugger?
A debugger is a tool to help you follow the logic of your test code as it runs. Debugging is attempting to figure out the cause of a problem in your test script, and then taking action to fix the problem.
Using the Debug command in UFT allows you to run your test line by line. This is helpful when developing your script when you’re having issues and you need to troubleshoot a problematic area in the script.
Microsoft Script Debugger Must be Installed
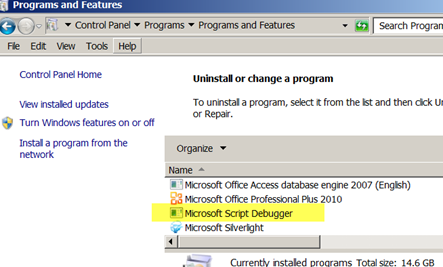
One “gotcha” you need to watch out for before using the UFT debug option is to make sure that you have the Microsoft Script Debugger installed. To double check, go to your Control Panel > Programs > Programs and Features and check to see if you have Microsoft Script Debugger listed:
If it hasn’t yet been installed, you can easily install it by going to Start >All Programs > HP Software >HP Unified Functional Testing> Tools > Additional Installation Requirements. Click Run.
The Seven Main Functions of the UFT Debugger
If it is not installed, the debug feature won’t be enabled.
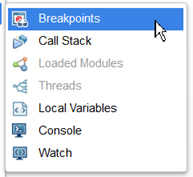
The UFT Debugger has seven main areas:
- Breakpoints
- Call Stack
- Loaded Modules ßAPI Specific
- Threads ß API Specific
- Local Variables
- Console
- Watch
In this post we’ll only cover the option that pertains to GUI testing.
Setting Breakpoints and Using the Breakpoints Pane
Breakpoints are cool because they allow you to stop at a particular line of code in your test script. This is a really handy feature if you’ve got a long script that is failing near the end of the test run and you need to pause the running to see why an issue is occurring. Let’s see a break point in action.
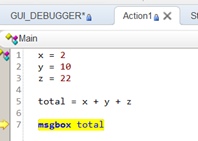
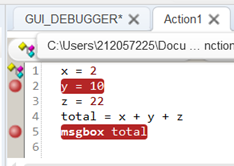
- Create a new UFT GUI test and add the following code in the Action1 tab:
x = 2
y = 10
z = 22
total = x + y + z
msgbox total
- You can add a breakpoint by clicking in the left gray margin next to the line of code that you want your script to stop on.
- In this example, click near the msgbox total line. A red ball should appear.
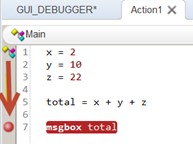
- Now when you run your script, UFT should pause on the msgbox total.
- Hit the F10 key on your keyboard to run the next line of code.
- A message box should appear with a value of 34.
Managing Breakpoints
The UFT breakpoint pane gives you a few options to manage your test scripts breakpoints.
- Add another breakpoint on the y = 10 line of code.
- You should now have two breakpoints.
- Now click on View>Debug> Breakpoints.
- The Breakpoint Pane should appear with a list of all the current break points you’ve have added into your script.
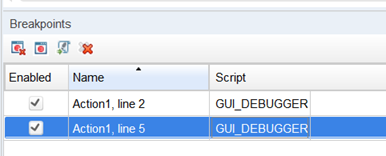
This pane allows you to manage your breakpoints and give you the ability to:
- Remove a single breakpoint (The first icon with the X)
- Enable or Disable all breakpoints (The second icon)
- Go to a specific breakpoint (The third icon)
- Remove all breakpoints
Since breakpoints are not saved when you save your script, I’m not sure how helpful this pane actually is. But if you have a bunch of breakpoints, it might be handy. You can easily remove a breakpoint without using this pane — just click on the Red Ball.
Local Variables
Run the Debug script again and this time while it is paused, click on the UFT View>Debug > Local Variables option. You should now see a list of the current values contained in all your scripts variables:
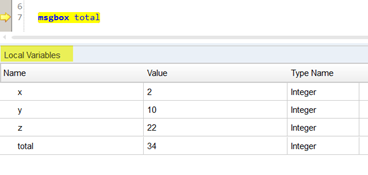
This is great if your script is failing and you need to confirm whether or not the value you expect is actually showing up.
Stepping through your test code
While debugging your script you can navigate a few different ways. The UFT’s debugger has three kinds of navigation options, called “stepping”:
- F11 – Step Into: Use this to execute the currently highlighted line of code. If the line of code happens to be calling a function the debugger will actually step into that function, line by line.
- F10 – Step Over: Use this to execute the currently highlighted line of code without stepping into any functions called by that line of code.
- Shift + F11 – Step Out: Sometimes while you are debugging a script you might accidentally hit Step Into when you meant to use Step Over. Using Step Out allows you to get back quickly.
Let’s check each of them out.
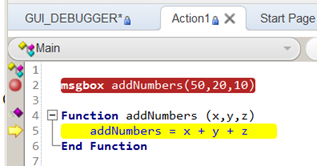
- Create a new script with the following code:
msgbox addNumbers(50,20,10)
Function addNumbers (x,y,z)
addNumbers = x + y + z
End Function
- Set a breakpoint on the msgbox addNumbers line.
- Run your test.
- When the test pauses, hit the F10 key to Step Over the highlighted line of code.
- A message box should appear with a value of 80.
Cool! Now let’s step into our code and see what happens:
- Set a breakpoint on the msgbox addNumbers line.
- Run your test.
- When the test pauses, hit the F11 key to step into the highlighted line of code.
- Notice how it actually goes into the next line of code that is located in your addNumbers function.
- Keep hitting F11 until the message box appears with a value of 80.
- If our function had 20 lines of code, hitting the F11 key would step through each line of code.
This is helpful for debugging issues that may be occurring deep in one of your function libraries.
Call Stack
A call stack is a view of the nested sequence of functions that have led to a certain point in your test code. For example:
- Create a new script and add the following code:
msgbox addnumbers(50,20,10)
Function addNumbers (x,y,z)
total = x + y + z
subTotal = subtractNumbers(total,5,4)
addNumbers = subTotal
End Function
Function subtractNumbers (x,y,z)
subtractNumbers = x + y + z
End Function
- Set a breakpoint on the msgbox addNumbers line.
- Run your script.
- When the script pauses, click on View>Debug> Call Stack.
- Hit the F11 key to step into.
- Look at the stack trace, which will show you the sequence of calls your script has made up until that point.
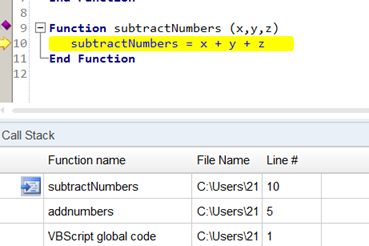
This can be helpful if you’re debugging and are paused inside a function and are not exactly sure how the path of execution got you to that point. It can help you get your bearings if you’re debugging long, nested functions. Just remember that the stack reads from the bottom up.
Console
The console can be a pretty powerful debugging tool. While you are debugging and UFT is paused on a line of code, you can perform multiple activities, like:
- Obtain info from the application under test
- Run a test method and display the return value
- Set or modify variables
- Call a native run time object method in your app
You can interact with the console by typing a line of code to be run in the context of your suspended run session.
Let go back to our original code example:
x = 2
y = 10
z = 22
total = x + y + z
msgbox total
-
-
- Add a breakpoint near the msgbox total line.
- Run your script.
- When the script pauses, click on View>Debug> Console.
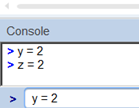
- At the Console > prompt, enter y = 2
- Hit Enter.
- At the Console > prompt, enter z = 2
- Hit Enter.
- Add a breakpoint near the msgbox total line.
-
-
-
- Hit the F10 key to Step Over the paused line of code.
- The message box should now show a value of 6 instead of 34.
- Hit the F10 key to Step Over the paused line of code.
-
Basically, what you’ve done is modified the variables values at run-time. The y variable now contains a value of 2 and the z variable now contains a value of 2. How cool is that?
Watch
The last GUI-based debugging option is the Watch pane. This allows you to set specific values to watch for selected variables and expressions in your test’s suspended run session. In a real world test script, you might have many variables but you may only be interested in 1 or 2 or them for your debugging purposes. This pane allows you to specify only the variables that you’d like to watch during the execution of your tests.
For example, say we only want to watch the Y value in our test example:
-
-
-
Add the following code:
x = 2
y = 10
z = 22
total = x + y + z
msgbox total
y = total
z = 10
y = total + z + 42
msgbox total
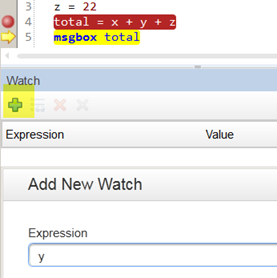
- Add a breakpoint near the msgbox total line.
- Run your script.
- When the script pauses, click on View>Debug> Watch.
- In the Watch Pane, click on the Add (+) icon.
- Under Add New Watch, enter Y
-
-
-
-
- Click OK.
-
You should now see a current value of Y in the Watch pane area.
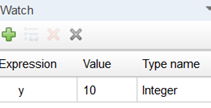
- Keep hitting the F10 key and watch how the current value of Y is updated as you step through the rest of the code
- Click OK.
-
This is really useful, because if you’re debugging code that has a lot of variables you can define just the few that you are interested while debugging.
Debugging Help
Debugging can be tough. One book I’ve found really helpful for learning some great debugging principles is Debugging: The 9 Indispensable Rules for Finding Even the Most Elusive Software and Hardware Problems. Check it out and become the Sherlock Homes of debugging test automation.